|
Graphical visualization
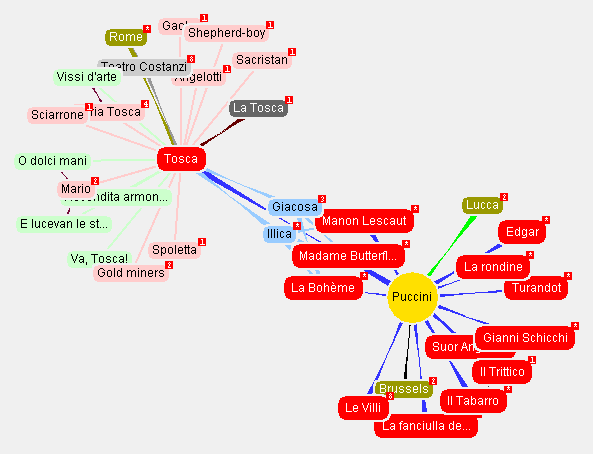
The Vizigator shows graphical visualizations of the structure of a topic map, which can be very useful for seeing larger patterns in complex data, or simply as a visually attractive and user-friendly alternative way of displaying the topic map.
The Vizigator has two parts: VizDesktop, a graphical interface for configuring the visualization, and Vizlet, a Java applet for displaying visualizations on the web. Using VizDesktop it is possible to configure which topic and association types to show, their shapes, sizes, colours, and fonts, attaching icons, and generally tuning the visualization for best results.
Setting up a visualization requires no programming, just creating a configuration in VizDesktop and deploying the applet together with the necessary web service interface on the server side.
|